30 December 2017

[Data Science] Machine Learning - Part 1, An Introduction

Sometimes I get questions from friends who are struggling with the term machine learning. How does a machine actually learn?

Well to answer that question, we need to understand what data analytics, or data science, is.

I can go on and on about data analytics, but simply put, my definition, data analytics is about describing a set of data in the most general way possible so we can make decisions or predictions.

We can use statistics to describe a data - what is the mode of the data? What is the mean? How about the variance and standard deviations?

We can also use statistics to test a new data to see if it belongs to the data we already have.

We can draw a best-fit line (linear regression) and use statistics (mean squares) to see if it is indeed ‘best-fit’. We can try to group data together by features (colours, size, etc).

So we can see, data analytics consist of two parts - statistics and going about deploying the statistical methods.

How can we describe the data?


Machine Learning is one of the tools for the latter part, the deploying statistical methods or other means (grouping, namely) to describe data. Of course, we can deploy the methods manually - we can try to draw lines and derive the equation of the line manually. However with the rapid growth in the size of data, doing so is becoming humanly impossible. Furthermore, computers are faster and less prone to mistake. (And hence the term data science was born.)

In short, machine learning is the use of computers and algorithms to describe data. However this is done not by explicitly coding the logic, but through recursive methods to find the optimal set of model parameters that minimizes inaccuracy (or maximises accuracy, I will explain myself for this clumsy wording soon).

In statistics, computing the mean squares error (MSE) is one of the ways to calculate the amount of error. The objective of the fitting line is to minimize the MSE, so that the fitted line can be used to make predictions.

A fitted line, but does it have minimum MSE?


In computer science speak, inaccuracies are costs described by a cost function that curiously looks like a MSE function. All machine learning algorithms (or methods) aims to minimize this cost functions.

I will elaborate in the next post.

Meantime, these are some of the resources (free!) that I helped me learn machine learning
Video Lectures on Statistical LearningThis is a series of video lectures based on the book Introduction to Statistical Learning (or ISR for short). You can download a free PDF copy of the book. Statistical learning is the statistician-speak of machine learning (which is a computer-scientist-speak). It covers most of the machine learning in a statisician point-of-view. I find it beneficial to go through this. You can also find this course in Stanford's Lagunita website. It is free!
Machine Learning by Andrew Ng on CourseraThis is like the de-facto go-to course to learn about the machine learning. Ng will go through the intuition behind the common machine learning algorithms. You will learn about matrix/vector multiplication (alot of it!). You will learn to use Matlab or Octave. From this, machine learning is nothing but a chunk of matrix multiplication. Nevertheless, IMO, it is a course worth the buck to get the certificate from Coursera. Ng also has a deep learning course that I am currently learning from.
Feel free to air your comments!

~ZF

[Investing] The Little Book of Common Sense Investing by John C. Bogle

I recently bought copy of The Little Book of Common Sense Investing by John C. Bogle. A 10th anniversary edition, updated and revised, may I add.

At the top of the cover is a review by the Oracle, Warrent Buffett:
"Rather than listen to the siren songs from investment managers, investors - large and small - should instead read Jack Bogle's The Litte Book of Common Sense Investing
That is it. Any investment book with the blessings from the Oracle himself must be a good book. You can also check out my reading list for the books I have read or am reading.

John C. Bogle is the founder and former chairman of the Vanguard Group. You may find the group a little familiar because it is indeed the Vanguard Group that manage the Vanguard 500 Index Fund. Warren Buffett had consistently backed investing in a low-cost index funds for everyday investors. This is easily validated by a simple Google search. Also, recently, Warren Buffett won a 10-year wager with a hedge fund manager; more about story here.

Back to the book. It is a little book, but it is also a thick one, a good 270 pages. It contains the rationale of behind investing in a low-cost and diversified index funds, and why it is a common sensical thing to do. The key take-away from the book I have is:
Participating in stocks investing is actually a loser's game. Whether profit or loss, the investment managers or brokers will always get a cut. Investors' earnings are eroding by transaction and management costs, and investing costs are exacerbated by transaction adn management costs. 
Only a low-cost and diversified index funds will allow an investor get his fair share of returns in the stock market, through capital appreication and dividends. 
There is also a chapter on Exchange Traded Fund (ETFs). Bogle warns against buying ETFs that are sector or industry specific and discouraged trading of ETFs.

So the investing principle is rather simple and straight forward (or common sense):

  1. Invests in a low-cost and diversified index fund. 
  2. ETFs that tracks a broad index (such as the Straits Times Index) is a good proxy. However do not trade the ETF.
  3.  Hold for long position. Forever if possible.

If you are starting out in investing, this may be a good book to read. If you are a seasoned investor, maybe this book can give you some ideas too.

To me, index investing is an auto-pilot and simple way of investing. There is no need to pick stocks, read financial statements of the companies that are picked (unless you enjoy doing so, like I do). It is low cost and risks are minimized.

Remember to check out my reading lists. There are some reading recommendations too!

Feel free to air your comments!

~ZF
29 December 2017

[Investing] Applied Dollar-Cost Averaging

In the previous post, I simulated the principle of dollar-cost averaging. Today I shall apply it onto real market data.

The data of interest is the Nikko AM STI ETF (G3B) that is traded in the Straits Times Index (STI). An ETF that tracks a broad-diversification index like the STI is similar to an index fund. Personally, I have invested in G3B via a regular savings plan, so this is also a little exercise for myself.

I have obtained 5-years' worth of monthly closing prices from Yahoo Finance for this exercise, and I will be investing $100 per month in the G3B. The effects of transaction fees are assumed to be negligible.


Price Vs Average Price

The average price is calculated by dividing the total amount invested by the units accumulated. The result is presented in the chart below.

As expected, the average price is smoothed and almost consistent. Consistent price = consistent cost. You may see that even with the very high price between Periods 50 and 60, the average price is still maintained.


Amount Invested Vs Holding Value

The following chart tracks the changes in holding value (the worth of the units that are bought and held) against the total amount invested.


You might have noticed that the portfolio started when the price is peaking, thus the Holdings Value exceeded the Amount Invested starting at about Period 15 because of the increasing prices, until at about Period 30, when prices began to dip.

Between Periods 30 and period 45 (this is slight more than a year, by the way), prices were suppressed, overall holding value declined too, but it was a good time for consolidating more units. As you can see, after everything recovers, the increase in holdings value is much greater, because of the consolidation period.

This is why we need to stay invested.


What if you started late?

It is never too late to start. I have also prepared similar charts for a 2-year investment period.


The trough period helps to consolidate units while the prices are suppressed.


From the charts, we see that thanks to the trough period, the holdings value exceeded the total amount invested quickly. Should an investor started 1 year later, at the midst of bullish price, he might not get that kind of performance. Instead, he might want to reduce (NOT stop) his contribution since the buying power has reduced, and increase only when prices are low again.

See, dollar-cost averaging works if one stays invested for a long, long time.

Feel free to comment!


~ZF


28 December 2017

[Investing] What is Dollar-Cost Averaging? A Simulated Example

Suppose you have $100, and you consistently and periodically buy a number of an item that you can afford with the $100.

If the price of the item does not vary much, the number of units that you can will also not vary much.

However, if the price of the item varies from period to period, then you get to buy more when the prices are low, and conversely, less if the prices are higher.

This is the principle of dollar-cost averaging, or DCA, the topic for today.

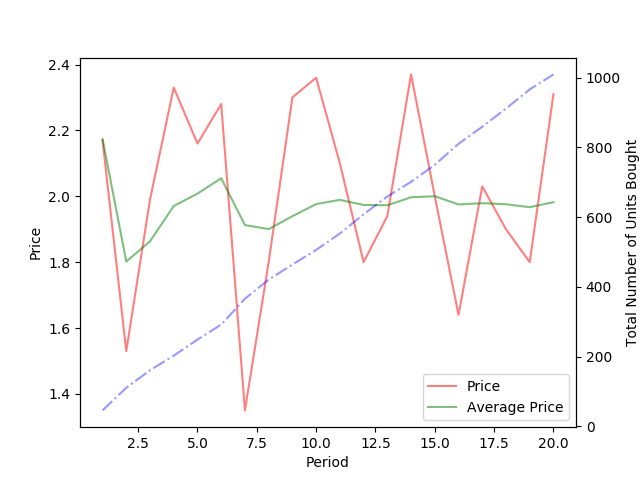
Let me illustate with some simulation and graphs. For the scenario, I am going to deploy DCA over 20 periods, each period I will spend $100 buy an item with a varying price. Prices are hypothetical and illustration purpose only.


Buy More When Prices Are Low

Well, it is expected to see that the number of units bought at each period is a mirror image of the prices.


What is the overall effect?


A Boring But Stable Cost

A cost that can be potentially lower too. The graph below illustrates.


Over a long period, the price of the units will be smoothen out, and at a level that closer to the lows.  Let's see if we extend period to 100 and see the over all effects.


Do you see the average price (green line) seems to be trending down, despite the volatility of prices?
Just for completeness, over a period of 200, the average price does decrease.


Simulated Long Term Performance (Perceived)

This is an update. I reckon it might be useful to see the total value of the investment too.

The graph below shows the overall performance over period = 100.
For a period 100 timeline, the total amount invested is $10,000, as shown by the green line. As time proceeds, the number of units increases, and the overall portfolio value becomes more sensitive to the price. Nevertheless, we can see that there is a potential to exceed the invested value.

In this simulation, prices are made volatile intentionally. If an investor invests in an index funds, the prices should be more stable; he should do better the simulated case.

Last point, the simularion also shows that one should not invest in a stock whose price is so volatile; that is not the intent of the DCA to make the movement of the portfolio value like a roller-coaster ride.


Benefits of DCA

However, the simulation is based on random number generation. In the market, while this kind of price movement is not uncommon, prices are generally cyclical. Nevertheless, I am confident that this little simulation of mine iterates some very important feature of DCA.

  1. The DCA is a great tool for long (very long, might I add) positions - it reduces the capital outlay, smoothens out risks and it is investing on auto-pilot. 
  2. It is especially good for investing in index funds, or ETFs that track an index, such as the STI, the STI ETF.
  3. It is good for discipline i investing. Many options are available in the form of a regular savings plan (RSP), such as the POSB Invest-Saver.*
*This is not an endorsement or recommendation for any investment products


But...

The DCA is not without flaws. In sustained bullish periods, the number of units that can be bought diminishes, until prices drop, and this makes the performance of the previous purchase look extraordinarily bad. You can see this in the graph above, the first few periods where there is a spike is akin to this situation. This should not be too much of a concern though if the investor is going very long. One can simply increase the principle to invest when prices are lower to avert this situation though, but the question remains - how low is low?

One of the golden rule in investing is to keep invested. DCA is one of those tools that can help the investor to do so.

Feel free to comment!

~ZF

P/S: Simulations are performed and plotted using Python.


Afternote: I shall attempt to do a simualtion with real data soon.